Why you should become an investor
While holding cash feels safe because the nominal dollar amount in your bank account never goes down, it carries a 100% mathematical certainty of losing real value over time due to inflation.
Here is the step-by-step reality of why holding excess cash guarantees a loss, while investing preserves and expands your true purchasing power.
1. The Invisible Loss: Nominal vs. Real Value
To understand the guaranteed loss of cash, you have to separate nominal value (the physical number on your bank statement) from real value (what those dollars can actually buy).
- Cash ($10,000 in a 0.05% Savings Account): In 10 years, your bank balance will still read roughly $10,000. However, if inflation averages 3% per year, goods that cost $10,000 today will cost $13,439 in a decade. Your $10,000 cash balance now only buys what $7,440 buys today—a ~25% loss in real purchasing power.
- Investments (Broad Stock Market Index): Over long horizons, equities have historically returned ~7% to 10% annually before inflation (and ~5% to 7% after inflation). By investing, your money grows faster than the price of goods, increasing your actual buying power.
2. Side-by-Side: $50,000 Over 20 Years
Assuming a historical average inflation rate of 3.0%:
| Scenario | Initial Amount | Growth Rate | Balance after 20 Years | Inflation-Adjusted Buying Power | Net Real Gain / Loss |
| Cash in Bank | $50,000 | 0.5% APY | $55,245 | $30,587 | -38.8% Loss |
| Broad Market ETF | $50,000 | 8.0% Annual | $233,048 | $129,033 | +158.1% Gain |
The Bottom Line: By sitting in cash for 20 years, you don’t keep your money safe—you lose nearly 40% of its real value. By investing in productive assets, your purchasing power more than doubles.
3. Why Cash Loses and Investments Win
Cash Has No Yield Engine
Cash is simply a medium of exchange; it produces nothing. It sits idle while central bank monetary expansion and supply costs naturally pull prices upward over time.
Investments Are Productive Assets
When you invest in broad index funds (like VTI or VT), you own fractional shares of thousands of actual businesses. These companies:
- Raise prices to match inflation (passing higher costs to consumers).
- Innovate, expand operations, and generate growing earnings.
- Reinvest profits and pay dividends back to shareholders.
Because businesses can adjust their pricing to match rising economic costs, equities naturally act as a long-term inflation hedge.
4. The Role of Cash vs. Investments
This does not mean you should hold zero cash. Cash serves a distinct structural purpose in a financial plan:
- Emergency Reserve (3–6 Months of Expenses): Kept in a High-Yield Savings Account (HYSA) or cash equivalent. You accept the slight inflation drag on this liquid buffer as insurance against job loss or urgent, unbudgeted expenses.
- Short-Term Goals (< 3 Years): Money needed for a down payment or upcoming purchase should remain in cash or short-term Treasuries because short-term stock market volatility poses a higher risk than 1–2 years of inflation.
- Long-Term Wealth Accumulation (3+ Years): Any money beyond your liquid emergency buffer and short-term needs must be invested into productive assets (stocks, real estate, bonds) to prevent systemic loss of wealth.
Chapter 1: DIVERSIFICATION, the free lunch
Based on modern portfolio theory, you will need to combine uncorrelated or negatively correlated assets to decrease portfolio volatility and drawback risk.
Volatility
Volatility is the size and speed of price swings. High volatility means big ups and downs; low volatility means a smoother ride. For your portfolio, high volatility increases the risk of losing money if you need to pull cash out during a dip.
Modern Portfolio Theory (MPT) in 3 Bullet Points
- Don’t judge an investment alone: Look at how it fits with everything else you own.
- Risk vs. Reward: Higher potential returns always require accepting more volatility.
- The “Free Lunch”: By mixing different types of investments, you can lower your overall risk without cutting your expected returns.
Why Uncorrelated Assets Lower Risk
Uncorrelated assets don’t move together—when one goes down, another might stay flat or go up.
- High Correlation (+1): Two stocks that crash at the same time during bad news.
- Uncorrelated (0): A stock and a bond that react differently to economic events.
When you hold uncorrelated assets, their gains smooth out each other’s losses.
If Asset A drops 15% during a recession, but Asset B rises 5%, your total portfolio only dips slightly. By dampening the extreme swings of individual investments, the portfolio as a whole becomes far less volatile than the items inside it.
Asset classes: Stocks, bonds, commodities and real estate (REIT)
Here is a breakdown of the four main asset classes in very simple terms:
1. Stocks (Ownership)
- What it is: Buying a tiny piece of ownership in a business.
- How it works: When you buy a stock (or equity), you become a part-owner of that company. If the business grows and makes more money, your share becomes more valuable. Some companies also pay out a portion of their profits directly to you as dividends.
- The Goal: Growth. Stocks carry higher risk because business performance fluctuates, but historically they offer the highest long-term returns.
- Analogy: Buying a fraction of a local lemonade stand. If they open 100 new stands, your slice is worth a lot more.
2. Bonds (IOUs / Debt)
- What it is: Loaning your money to a government or corporation.
- How it works: When you buy a bond, you are acting as the bank. The borrower promises to pay you back your initial money (principal) on a set date in the future, while paying you regular interest payments along the way.
- The Goal: Stability and Income. Bonds are generally safer than stocks, providing steady, predictable cash flow, though their long-term growth potential is lower.
- Analogy: Lending $100 to a reliable friend who promises to give you $5 back every year in interest, plus your $100 back in 5 years.
3. REITs – Real Estate Investment Trusts (Property)
- What it is: Buying a pool of real estate without having to be a landlord.
- How it works: A REIT is a company that owns, operates, or finances income-producing real estate (like apartment complexes, shopping centers, office buildings, or warehouses). By law, REITs must pay out at least 90% of their taxable income to shareholders as dividends.
- The Goal: Real estate exposure and high dividend yield. It allows you to invest in property without dealing with maintenance, tenants, or mortgages.
- Analogy: Pitching in with thousands of other people to buy a giant apartment building, then collecting your tiny share of the monthly rent checks.
4. Commodities (Raw Materials)
- What it is: Basic physical goods and natural resources used in everyday life.
- How it works: This category includes items like precious metals (gold, silver), energy (crude oil, natural gas), and agricultural products (wheat, corn, coffee). Their prices move strictly based on supply and demand—they don’t earn profits or pay dividends like businesses do.
- The Goal: Inflation protection and diversification. Commodities are often used to hedge against rising prices or economic instability (especially gold).
- Analogy: Buying physical barrels of oil or gold bars and keeping them in a vault, hoping someone will pay more for them later when supply gets tight.
Core Comparison
| Asset Class | What You Own | Primary Driver of Value | Typical Investor Goal |
| Stocks | Ownership share in a business | Company earnings & growth | Long-term capital growth |
| Bonds | An IOU / debt contract | Interest rates & borrower creditworthiness | Income & stability |
| REITs | Share of commercial property pool | Tenant rent payments & property values | High dividend cash flow |
| Commodities | Physical raw materials | Global supply & demand / inflation | Inflation hedge & protection |
Chapter 2: Exchange Traded Funds (ETFs)
An Exchange-Traded Fund (ETF) is an investment fund that holds a collection of individual assets—such as stocks, bonds, or commodities—and trades on public stock exchanges just like a single share of stock.
When you buy one share of an ETF, you are buying a small slice of a larger pool of assets. For example, an S&P 500 ETF (like VOO or IVV) buys shares in 500 of the largest publicly traded U.S. companies. Instead of purchasing 500 separate stocks yourself, a single purchase gives you instant exposure to all 500.
Key Differences: ETFs vs. Individual Stocks
| Feature | Individual Stock | Exchange-Traded Fund (ETF) |
| Diversification | Single company exposure | Dozens to thousands of companies |
| Single-Company Risk | High (susceptible to corporate scandals, earnings misses) | Low (a single company failing won’t ruin the fund) |
| Effort & Time Required | High (requires ongoing research and financial analysis) | Low (hands-off management) |
| Cost to Build Portfolio | High transaction/trading complexity across many holdings | Single trade provides immediate portfolio breadth |
| Expected Return Profile | Highly volatile; potential for huge gains or total loss | Market-average return; lower volatility |
Why ETFs Are Generally Better for Most Investors
1. Instant Diversification (Eliminating “Single-Stock Risk”)
If you buy stock in a single company, your investment is entirely tied to that company’s leadership, operational success, and market position. If it goes bankrupt, you lose 100% of your capital.
An ETF spreads your money across many companies and sectors. If one company in an index of 500 goes to zero, it represents less than a fraction of a percent of your total portfolio, leaving the remaining 99%+ of your wealth intact.
2. Lower Volatility & Smoother Growth
Individual stocks can experience massive single-day swings based on quarterly earnings reports or corporate news. Because an ETF bundles hundreds of companies together, the strong performance of some companies helps offset downturns in others. This dampens extreme price swings and creates a much smoother growth trajectory over time.
3. Low Management Costs & High Efficiency
Broad-market index ETFs typically charge minimal management fees (known as expense ratios), often as low as 0.03% per year ($3 for every $10,000 invested). Managing a fully diversified portfolio yourself would require tracking dozens of individual equities, managing rebalancing trades, and incurring significant administrative complexity.
4. Historical Outperformance of the Broader Market
Decades of financial research show that the vast majority of individual stocks underperform broad market indexes over long periods. A small percentage of top-performing companies drive most of the stock market’s overall returns. By holding a broad ETF, you guarantee that you own those top-performing outliers rather than trying to guess which individual stocks will win.
5. Hands-Off Simplicity
Investing in individual stocks requires evaluating balance sheets, tracking quarterly earnings, and analyzing competitive moats. An ETF automates this process—the fund manager or underlying index automatically handles rebalancing, adding rising companies, and removing failing ones.
Chapter 3: ETF examples and how to construct a portfolio
This chapter is to give information about asset classes. Once you have done reading this chapter, continue chapter 4 for an easier portfolio construction.
To build comprehensive multi-asset portfolios including all six requested asset classes—Domestic Stocks, International Stocks, Domestic Bonds, International Bonds, Commodities, and REITs—we can select low-cost, liquid ETFs,primarily from Vanguard:
Recommended Building Block ETFs
- Domestic Stocks (US Equity):
VTI(Vanguard Total Stock Market ETF) - International Stocks:
VXUS(Vanguard Total International Stock ETF) - Domestic Bonds:
BND(Vanguard Total Bond Market ETF) - International Bonds:
BNDX(Vanguard Total International Bond ETF) - REITs (Real Estate):
VNQ(Vanguard Real Estate ETF) - Commodities:
DBC(Invesco DB Commodity Index Tracking Fund) (Note: Vanguard does not issue a standalone broad commodity futures ETF)
Example Portfolios across 3 Risk Profiles
The expected annualized returns and projected annual volatility (standard deviation) below reflect long-term capital market expectations (hypothetical):
| Portfolio Profile | Domestic Stocks (VTI) | Intl Stocks (VXUS) | Domestic Bonds (BND) | Intl Bonds (BNDX) | REITs (VNQ) | Commodities (DBC) | Expected Return | Projected Volatility |
| 1. Aggressive Growth | 50% | 30% | 5% | 5% | 5% | 5% | 7.4% – 9.4% | 16.2% – 18.8% |
| 2. Moderate / Balanced | 35% | 25% | 20% | 10% | 5% | 5% | 6.0% – 7.0% | 10.2% – 11.8% |
| 3. Capital Preservation, All weather | 15% | 10% | 35% | 20% | 5% | 15% | 4.6% – 5.6% | 6.8% – 8.2% |
Role of Each Asset Class in the Strategy
- Domestic & International Stocks (
VTI/VXUS): Drive long-term capital appreciation. Holding both US and ex-US shares protects against prolonged regional underperformance or currency movements. - Domestic Bonds (
BND): High-quality US Treasuries and investment-grade corporate bonds provide stability and fixed income, anchored to US interest rate cycles. - International Bonds (
BNDX): Currency-hedged international investment-grade bonds lower overall fixed-income volatility by diversifying central bank rate movements across global economies. - REITs (
VNQ): Offer equity-like long-term returns with above-average dividend yields derived from real estate rentals, often moving independently of broader tech/industrial equities. - Commodities (
DBC): Serve as an explicit hedge against inflation and supply shocks, performing best during late-cycle economic overheating or stagflation when stocks and bonds face headwind risks.
Chapter 4: Easier portfolio construction for a beginner investor
This portfolio does not include individual real estate and commodity ETFs. It makes it simple, but slightly vulnerable to stagflation (which is a rare event, but completely possible). Since VT ETF (below) also has energy, commercial real estate and commodity companies, you will have enough diversification and start investing right away.
A 2-Fund Portfolio using VT (Vanguard Total World Stock ETF) and BNDW (Vanguard Total World Bond ETF) is one of the simplest and most complete global investment strategies available.
With just two ticker symbols, you capture essentially the entire global investable market—holding over 9,500 equities and over 17,000 bonds across dozens of developed and emerging countries.
Building Block ETFs
- Global Equities:
VT(Vanguard Total World Stock ETF)- Covers: ~60% US / ~40% International stocks (large, mid, and small cap).
- Global Fixed Income:
BNDW(Vanguard Total World Bond ETF)- Covers: ~50% US / ~50% International investment-grade bonds (currency-hedged to USD to lower volatility).
2-Fund Portfolios Across 3 Risk Profiles
Because this is a simple 2-fund split, allocation comes down purely to choosing your equity-to-fixed-income ratio based on your timeline and risk tolerance:
| Portfolio Profile | Global Stocks (VT) | Global Bonds (BNDW) | Historical/Expected Return | Projected Volatility | Best Suited For |
| 1. Aggressive Growth (90/10) | 90% | 10% | 7.8% – 8.8% | 14.0% – 15.5% | Investors 15+ years from retirement seeking maximum growth with a small ballast. |
| 2. Moderate / Balanced (60/40) | 60% | 40% | 6.2% – 7.2% | 9.5% – 11.0% | Investors balancing wealth accumulation with drawdown protection. |
| 3. Capital Preservation (30/70) | 30% | 70% | 4.5% – 5.5% | 5.5% – 7.0% | Investors in or near retirement prioritizing income and lower downside risk. |
Breakdown of a $100,000 Moderate (60/40) Portfolio
| ETF Ticker | Name | Target Split | $ Value | Expense Ratio | Primary Role |
VT | Vanguard Total World Stock ETF | 60% | $60,000 | 0.07% | Core driver of long-term capital expansion and world equity growth. |
BNDW | Vanguard Total World Bond ETF | 40% | $40,000 | 0.05% | Capital preservation, income, and drawdown mitigation during stock crashes. |
| Total | 100% | $100,000 | ~0.06% avg | Ultra-low-cost, automated global diversification. |
Key Advantages & Trade-Offs
Advantages
- Zero Regional Bias / Automated Market Weighting:
VTandBNDWautomatically adjust their internal holdings to reflect world market capitalization. You don’t have to guess whether the US or international markets will perform better in any given decade. - Extreme Simplicity: Rebalancing takes less than 2 minutes once or twice a year—you simply adjust the ratio between
VTandBNDW. - Institutional-Grade Diversification: You hold over 26,000 underlying securities across a single brokerage account.
Trade-Offs to Consider
- Lack of Asset Class Customization: By consolidating all equities into
VTand all bonds intoBNDW, you give up the ability to tilt toward specific asset classes like REITs or Commodities. - Foreign Tax Credit Efficiency: Holding international equities inside
VT(rather than a standalone fund likeVXUS) in a taxable brokerage account prevents you from claiming the Foreign Tax Credit on taxes paid to foreign governments. For this reason,VTis often best held inside tax-advantaged accounts (like an IRA or 401(k)).
Chapter 5: Economic quadrants and annual return of asset classes
The economic quadrants (often called economic regimes) map the macro environment using two fundamental variables: Economic Growth (GDP output) and Inflation (consumer/producer prices).
Because different asset classes thrive in different combinations of growth and inflation, tracking these four environments helps explain why markets behave the way they do across economic cycles.
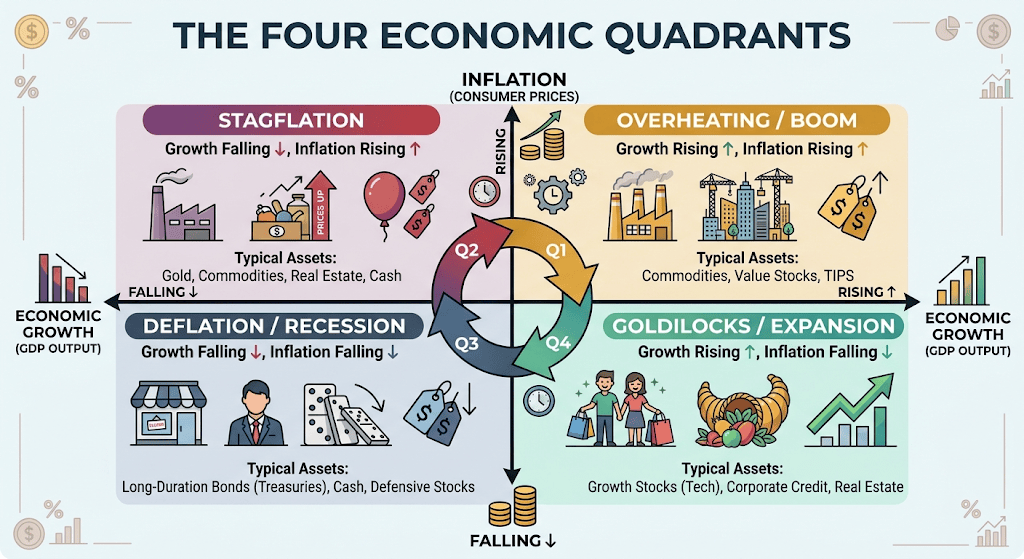
1. Quadrant 1: Overheating / Inflationary Boom
- Conditions: Growth Rising ↑ | Inflation Rising ↑
- Environment: Corporate profits are strong, consumer demand is robust, and unemployment is low. However, high demand pushes commodity prices up, supply chains tighten, and central banks typically respond by hiking interest rates to prevent the economy from running too hot.
- Top-Performing Assets: Commodities (energy, industrial metals), Treasury Inflation-Protected Securities (TIPS), Short-Duration Bonds, Value Stocks, Cash.
- Underperforming Assets: Long-Duration Fixed Income (bonds suffer as interest rates rise), High-Growth Tech Stocks (compressed valuation multiples).
2. Quadrant 2: Stagflation
- Conditions: Growth Falling ↓ | Inflation Rising ↑
- Environment: The most challenging regime for investors. Supply shocks, high energy prices, or wage-price spirals push prices up while economic output slows down. Central banks face a dilemma: tightening monetary policy further hurts growth, but easing worsens inflation.
- Top-Performing Assets: Commodities (especially Gold and Energy), Real Estate/Tangible Assets, TIPS, Cash.
- Underperforming Assets: Traditional 60/40 Equity and Bond Portfolios (both stocks and nominal bonds often suffer simultaneously).
3. Quadrant 3: Deflationary Bust / Recession
- Conditions: Growth Falling ↓ | Inflation Falling ↓
- Environment: Economic output contracts, unemployment rises, and consumer demand collapses. Central banks cut interest rates aggressively and inject liquidity into the banking system to stimulate borrowing and spending.
- Top-Performing Assets: Long-Term Nominal Government Bonds (Treasuries), High-Grade Corporate Bonds, Cash/Cash Equivalents.
- Underperforming Assets: Equities (particularly cyclical sectors like industrials and financials), High-Yield/Junk Bonds (rising default risk), Commodities.
4. Quadrant 4: Goldilocks Expansion
- Conditions: Growth Rising ↑ | Inflation Falling ↓
- Environment: The ideal economic backdrop. Productivity gains and stable supply chains allow the economy to expand without generating excess inflation. Central banks can maintain loose or neutral monetary policy.
- Top-Performing Assets: Equities (broad stock market, especially Growth and Tech stocks), Corporate Credit, Real Estate.
- Underperforming Assets: Cash, Gold, Commodities (underperform relative to equities).
How Quadrants Drive Diversification
Because no single asset class performs well in all four regimes, broad asset allocation relies on combining instruments that balance these forces:
| Asset Class | Inflation Rising | Inflation Falling | Growth Rising | Growth Falling |
| Equities | Neutral / Negative | Positive | Positive | Negative |
| Nominal Bonds | Negative | Positive | Negative | Positive |
| Commodities / Gold | Positive | Negative | Positive | Negative |
| Cash / TIPS | Positive | Neutral | Neutral | Neutral |
Chapter 6: Time in the market beats Timing the market
Investors sometimes feel clever to predict market cycles. They are almost always wrong. 90% of active fund managers won’t beat simply putting your money into VT ETF. Never time the market (sell when expecting market downturn and buy when you expect market bull run), here are the reasons:
- The Market’s Best Days Occur in Clusters: A massive portion of long-term stock market gains happens on just a handful of trading days. Missing merely the 10 best trading days over a multi-decade period can cut your total lifetime returns in half—and those best days almost always occur during or immediately after major panics, making them impossible to predict.
- You Must Be Right Twice: Successful market timing requires making two perfect decisions: knowing precisely when to sell before a crash and knowing precisely when to buy back in before the recovery. Getting even one of these calls wrong invalidates the entire strategy.
- Emotions Drive Poor Timing: Investor psychology naturally works against market timing. Human instinct tempts people to buy at peak optimism (when prices are highest) and sell out of fear during market bottoms (when prices are lowest), systematically locking in real losses.
- Taxes and Drag Cut Deep: Active trading in a taxable account triggers short-term capital gains taxes (taxed as regular income) and transaction costs. Frequent buying and selling creates a high structural hurdle compared to holding long-term investments.
- Time in the Market Beats Timing the Market: Decades of empirical market data show that remaining consistently invested—regardless of short-term news, rate decisions, or geopolitical volatility—consistently outperforms cash-hoarding and opportunistic dip-buying strategies over long time horizons.
Chapter 7: Are you waiting for a crash? Consider dollar cost averaging.
1. Why Waiting for a Market Crash Loses Money
Holding cash on the sidelines while waiting for a stock market pullback or crash is a form of market timing, and it regularly underperforms continuous participation due to three primary forces:
- Opportunity Cost of the Upward Trend: Historically, the S&P 500 trends upward over long horizons, spending far more time in bull expansions than in bear market contractions. Money sitting in cash earns minimal yield relative to compounding equity returns, missing out on dividends and capital growth during the waiting period.
- The “Dip” May Be Higher Than Today’s Price: If the market advances 30% over the next two years before experiencing a 15% correction, buying during that “crash” still leaves you buying at a higher entry price than if you had simply invested today.
- Psychological Execution Risk: When major crashes actually occur (such as 2008 or March 2020), economic sentiment is severely negative. Investors holding cash out of fear rarely buy at the bottom; they typically wait for “clarity,” missing the sharpest phase of the recovery and compounding their underperformance.
2. All-Time Highs Are Normal for Growing Economies
It is a common behavioral misconception that buying at an All-Time High (ATH) means buying at the absolute top of a market cycle. In reality, ATHs are a standard feature of long-term wealth creation:
- Frequency: The S&P 500 has closed at a new ATH on roughly 5% to 7% of all trading days over the last several decades. In strong bull years (such as 1995, 2017, or 2021), the market regularly registers 30 to 70 separate record highs in a single year.
- Economic Drivers: Record high stock prices simply reflect fundamental economic expansion: underlying corporate earnings growth, productivity gains, population growth, and long-term monetary inflation.
- Forward Performance: Empirical research demonstrates that purchasing stocks at an ATH yields subsequent 1-year, 3-year, and 5-year average returns that are nearly identical to buying on any random trading day.
3. Dollar-Cost Averaging (DCA) as a Defense Mechanism
Dollar-Cost Averaging (DCA) is the systematic process of investing a fixed dollar amount at regular intervals (e.g., monthly) regardless of price levels.
- Behavioral Armor: DCA eliminates the cognitive strain of timing market entries. It neutralizes impulse decisions, preventing panic-selling during drops and speculative buying during manias.
- Automated Price Advantage: Because the purchase dollar amount remains static, the strategy automatically buys more shares when prices fall and fewer shares when prices rise, lowering your weighted average cost per share over time during volatile periods.
- Mitigating Regret Risk: For investors prone to psychological paralysis, DCA provides a emotional bridge between sitting in cash and taking market risk.
4. Real Historical Scenarios: Lump Sum vs. DCA
Mathematically, historical studies from Vanguard and Morgan Stanley show that investing a Lump Sum beats DCA approximately 66% to 68% of the time over a 12-month phase-in period. This occurs because markets rise more often than they fall.
However, DCA demonstrates its protective value precisely when an investor enters right before a severe market drop:
Scenario A: The 2007-2008 Financial Crisis (Peak-to-Trough Crash)
- Context: An investor has $120,000 in cash to deploy in October 2007, precisely at the S&P 500 pre-crisis peak before a ~55% drawdown.
| Strategy | Execution Structure | Outcome During the Crash | Recovery Trajectory |
| Lump Sum | Invests $120,000 immediately in Oct 2007. | Portfolio drops to ~$54,000 by March 2009. | Takes until mid-2012 (nearly 5 years) just to break even on principal. |
| DCA | Invests $10,000/month across 12 months (Oct 2007 -Sept 2008). | Continues buying as prices drop 20%, 30%, and 40% lower. | Lowered average cost per share allowed full recovery by 2010, roughly 2 years ahead of Lump Sum. |
Scenario B: A Strong Bull Market (e.g., 2013 or 2023)
- Context: An investor has $120,000 sitting in cash in January during a persistent bull run.
| Strategy | Execution Structure | Outcome Across 12 Months | Net Difference |
| Lump Sum | Invests $120,000 immediately in January. | Receives 100% exposure to the full annual market gain (e.g., +26% in 2023). | Clear Winner: Maximizes compound return by keeping cash fully deployed. |
| DCA | Invests $10,000/month over 12 months. | Uninvested cash sits in money market accounts earning low yield while stock prices rise each month. | Underperforms: Average cost per share increases each month, leaving final wealth lower than Lump Sum. |
Core Summary
- Lump Sum Investing is mathematically optimal most of the time because markets have a positive drift.
- Dollar-Cost Averaging is behaviorally optimal if the risk of short-term downside regret would cause you to panic or stay in cash indefinitely.
- All-Time Highs are signals of a growing market, not reason to hold back cash. Waiting for a crash usually results in buying back in at higher prices than today’s baseline.


